Why I built Payday to Pension
By Jiazhen Xie · 22 October 2026
Salary is a number we pay attention to. We negotiate it. Compare it. Work out what a new role would mean after tax.
Pension is often a percentage we accepted when we joined the company.
5% from me. Something from the employer. There is tax relief. Probably fine.
It’s easy to leave it there. There are enough things to think about this month. Retirement is somewhere much further down the backlog.
But a good salary doesn’t answer a fairly basic question: when that salary stops, what pays for your life?
I built Payday to Pension to make that question easier to explore. All salary figures below are hypothetical examples.
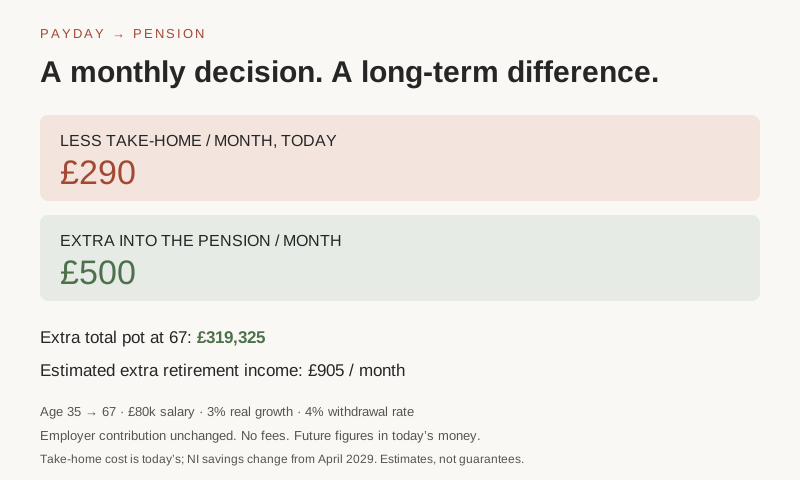
Here is a concrete example. A 35-year-old earning £80,000 adds £500 a month through salary sacrifice. In the model, today’s take-home pay falls by about £290. The employer contribution stays the same.
Over 32 years, the extra contributions could build an extra pot of around £319,000 in today’s money at 3% real growth, before fees. That is a total pot, not £319,000 of income a year. At the model’s 4% withdrawal rate and simplified retirement tax, it could add around £905 a month to retirement income.
The monthly cash cost is a snapshot of today’s rules. The model changes National Insurance relief from April 2029. The pot projection assumes the £500 gross contribution continues throughout. These are assumptions to explore, not promised outcomes.
Why: the percentage hides the actual question
There are plenty of pension explanations online. Salary sacrifice, employer matching, tax relief, compound growth. You can recognise all the terms and still struggle to connect them to your own payslip.
The bit I wanted to see was the connection. If I change this number today, what happens to my take-home pay? And what might that buy me later?
Even the starting number can be misleading.
Take an £80,000 salary. Suppose the pension setup is 5% from you and 3% from your employer. That sounds like £6,400 a year going into the pension.
It would be, if those percentages applied to the whole salary.
But some schemes use qualifying earnings. Under the band currently listed on GOV.UK, that means earnings between £6,240 and £50,270. In this example, the 8% applies to £44,030. About £3,522 a year, or £294 a month, goes in. On the whole salary it would be about £533 a month.
Same headline percentages. Quite different amounts.
This isn’t a claim about every employer. Scheme rules vary. It is a reason to check what the percentage on your benefits page is actually a percentage of.
A pay rise above the qualifying-earnings ceiling can leave those contributions unchanged. Your lifestyle might grow with your salary while your pension contributions don’t.
What: start with a monthly income you can picture
Most of us have a better feel for a monthly budget than a retirement pot.
£500,000 sounds big. Whether it supports the life you have in mind is another question.
The tool now starts with a nearer decision: if I put more into my pension, how much cash do I actually give up? Enter this year’s base salary, bonus and current pension setup. It compares adjusted net income before and after the change, including the £100,000 Personal Allowance threshold. The retirement projection is a separate second step: monthly income in today’s money, based on ages and a pot you can adjust.
It shows an estimated retirement income alongside your target. Then it brings the question back to payday: what leaves your pay, what the employer adds, and what the change might produce later.
You can explore contributing more, working longer, employer matching and other savings. You can also see when the numbers still don’t get you to the target. That’s useful information too.
You must confirm the contribution method and earnings basis before seeing a personal comparison. The labelled example is there if you want to explore first. Relief at source shows the initial cash payment separately from the final cost after any extra HMRC relief. The long-term projection opens only when you choose to go further.
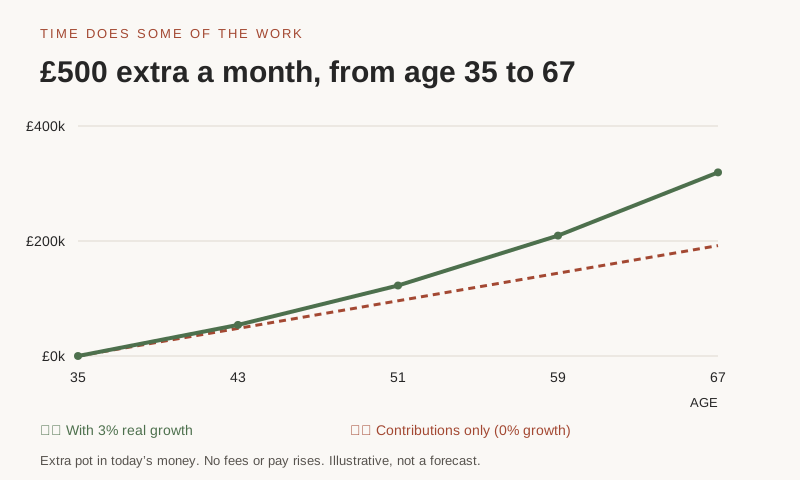
The dashed line is what you put in: £192,000 over 32 years. The solid line adds a steady 3% real return. Actual markets won’t follow that line. The point is to see what comes from contributions and what depends on growth.
How: change one thing and follow it through
Start with this tax year’s income: base salary, expected cash bonus and current pension contributions. Then choose an extra gross amount to compare. Age and retirement targets come later.
Then get closer to your actual setup. Check your pension balance, contribution percentages and which earnings they apply to. Find out whether your employer offers matching and how contributions are taken from your pay.
That last detail matters. Salary sacrifice, net pay and relief at source handle tax relief differently. With relief at source, the provider adds basic-rate relief; if you pay tax above that rate, you may need to claim additional relief yourself. Hearing that pensions are tax-efficient doesn’t tell you whether your own relief has been fully claimed.
Now change one thing: the extra gross contribution. See what happens to cash and adjusted net income. If you are close to £100,000, try the amount needed to reach that level. This is a comparison, not a recommendation; access to your cash still matters. Childcare eligibility may be affected, but the tool does not count childcare as a saving.
I find this much easier to reason about than reading another explanation of why saving earlier is good. You have a starting point, an assumption you can change, and a visible result.
Where I would be careful with the result
This is a simplified calculator. It assumes steady contributions and a constant real return. Your career and investments won’t behave that neatly. The model also leaves out fees and career breaks.
The retirement income is an estimate using a withdrawal-rate assumption, not a guaranteed payment. The State Pension figure assumes full entitlement at the age entered. Check your own forecast rather than assuming you’ll receive that amount.
If you earn more, the omitted details can matter more. The tool doesn’t model Scottish Income Tax, tapered annual allowances, carry-forward or higher-rate tax in retirement. The short-term comparison separates extra relief under relief at source from the initial payment, so a future claim is not presented as cash already on your payslip. The separate long-term projection still uses a simpler payslip model. Treat the result as a way to understand the moving parts, rather than a complete tax calculation.
Pensions also tie money up. An emergency fund, a mortgage, family costs and access to savings before retirement belong in the decision. This page can’t decide those priorities for you.
I wanted something that makes the next question clearer. Maybe it’s “what does my employer match?” Maybe it’s “which pay is this based on?” Maybe it’s simply “what would enough actually look like?”
Try Payday to Pension with your own numbers →
No account. Inputs stay in your browser. If you copy a share link, the numbers are included in that link, so share it with that in mind.